Data analysis
Exploring data
The Reconstructions section of this website offers tools to visualize a variety of paleoclimate reconstructions and access published papers, data, and code. If you'd like to explore the data more yourself, you can download a reconstruction and analyze it in a programming language like Python or R.
If you're new to programming, a variety of free tutorials can be found online. This page has some code examples to help dive into the data.
1. Installing Python or R
If you're new to scientific programming, Python or R is a good place to start. Both are free and can be install in Linux, Windows, or Mac. If you're not sure which one to use, ask your colleagues. The examples below will use Python.
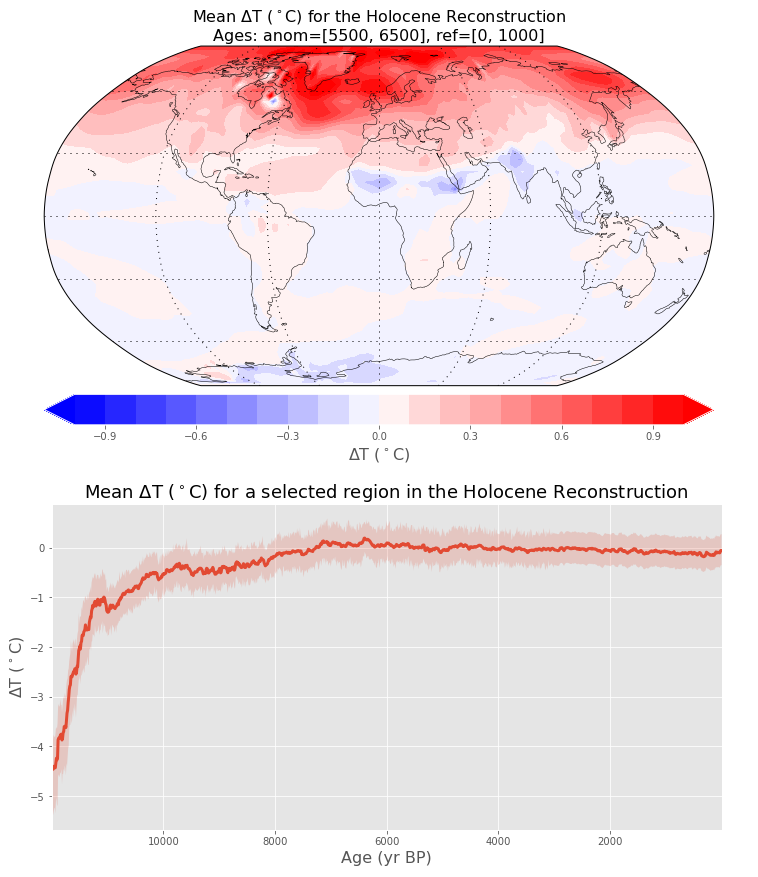
Sample figures from the tutorial below.
2. Downloading a paleoclimate reconstruction
The Reconstructions section of this website provides links to a variety of paleoclimate reconstructions. When you find a reconstruction you want to analyze, use the Data button below the description to find the data. For gridded data, NetCDF (.nc) is a common format. Other data may be stored in CSV format.
3. Code examples for data analysis
In this section, you can find basic pieces of code for loading data and making figures.
Tutorial: Loading data and making figures in Python