The Common Era
Welcome to the Common Era
The Common Era covers the last 2000 years. During this time, humans became more widespread and technology became more advanced. Many proxy records, primarily tree rings, provide high resolution information about this period.
Three temperature reconstructions that cover this period are the LMR, PHYDA, and Global Common Era Multiproxy Temperature Field Reconstructions. LMR and PHYDA use paleoclimate data assimilation while the multiproxy reconstructions use a variety of methods. Additionally, you can browse the North American Drought Atlas (NADA) and other regional drought reconstructions below.
To the right: See overview figures of the temperature reconstructions.
Below: Open the visualizer to explore maps and time series. See the published papers to learn more about methodology and results, or browse the data and code.
Use the "Comparison" link at the bottom to compare between reconstructions."
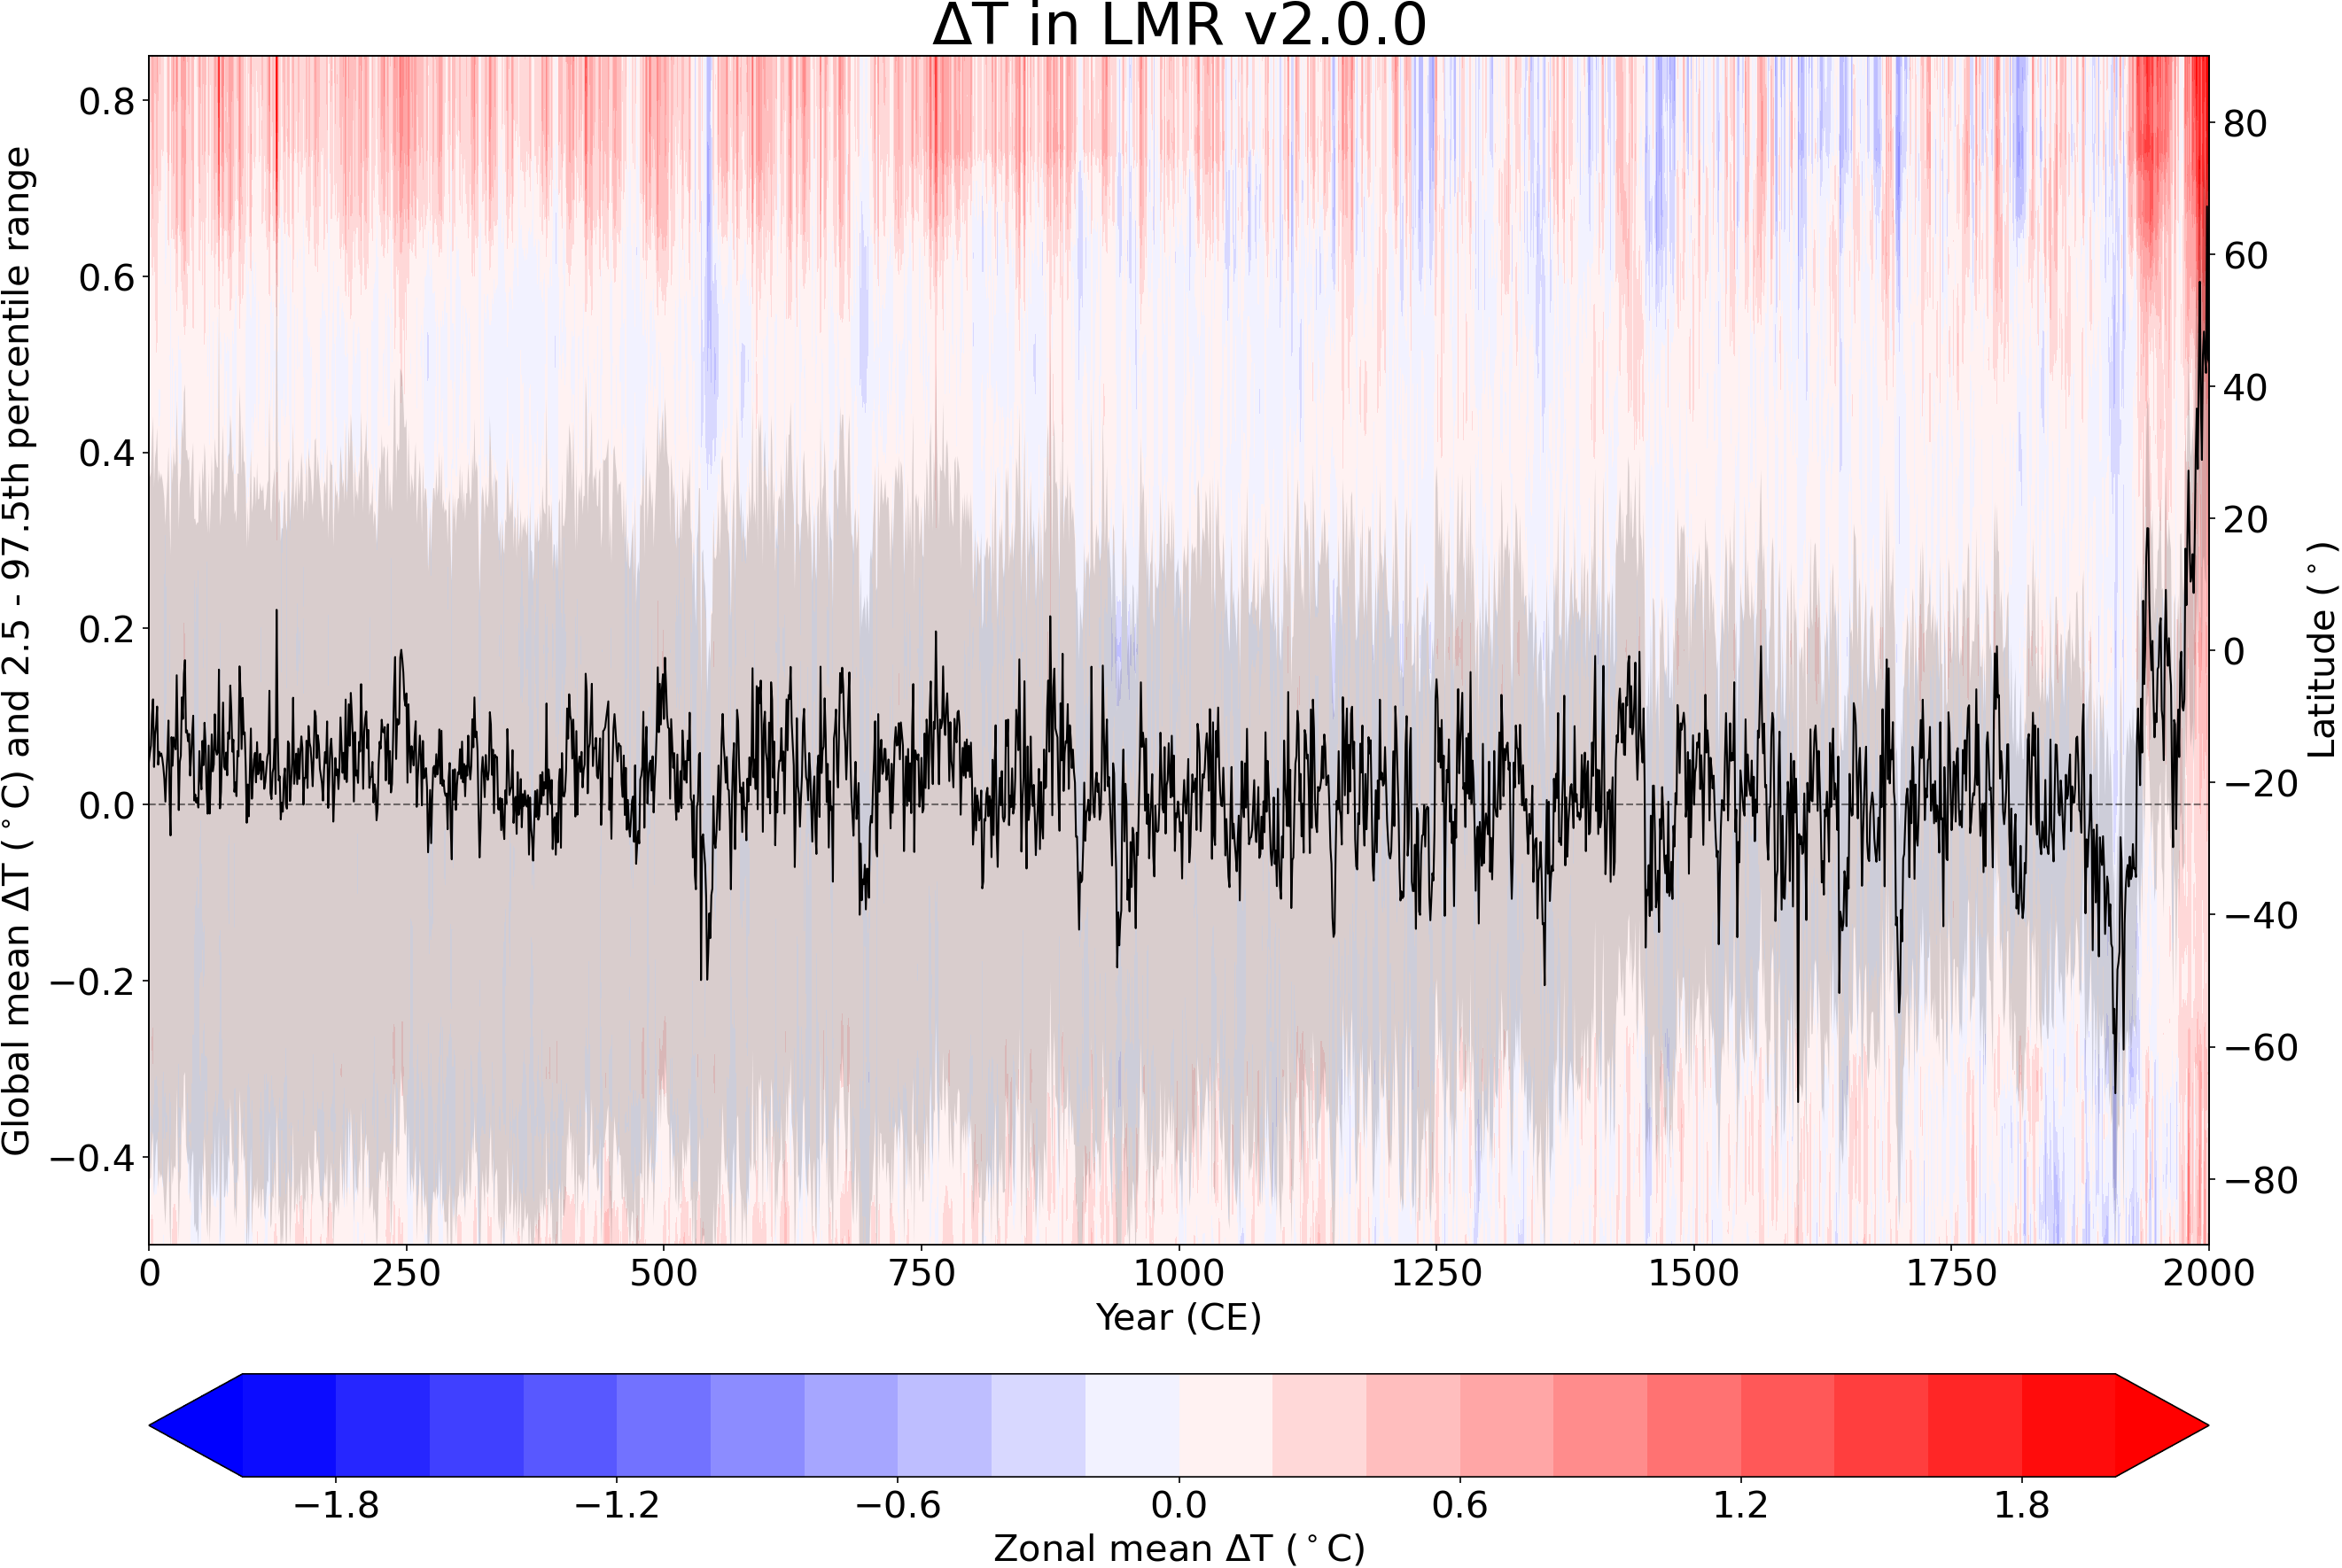
Reconstructed temperature - global mean (line, with shading for 95% ensemble range) and zonal mean (colors) relative to 0-1 ka.

Last Millennium Reanalysis
The Last Millennium Reanalysis (LMR) uses a data assimilation approach to combine proxy data with information from a model. The result is globally complete reconstruction of annual climate over the Common Era. Temperature and precipitation can be browsed in the visualizer and additional variables can be downloaded at the "data" link. Proxies used: LMR v2.1: PAGES2k v2 with some edits; LMR v2.0: PAGES2k v2 and additional records. Model used: CCSM4 Last Millennium simulation.
Visualizer Paper Data Code
Last Millennium Reanalysis Seasonal
The Last Millennium Reanalysis (LMR) Seasonal uses a data assimilation approach to combine proxy data with information from a model. The result is globally complete reconstruction of climate during DJF, MAM, JJA, and SON over the Common Era. Temperature can be browsed in the visualizer and additional variables can be downloaded at the "data" link. All maps are shown relative to the mean temperature of that season during the last 1000 years.
Visualizer Data Code
Paleo Hydrodynamics Data Assimilation product
The Paleo Hydrodynamics Data Assimilation product (PHYDA) uses a data assimilation approach to combine proxy data with information from a model. The result is globally complete reconstruction of climate over the Common Era, with a focus on hydroclimate. Temperature, PDSI, and SPEI can be browsed in the visualizer and additional variables can be downloaded at the "data" link. Annual quantities are averaged from April to March of the next year. Proxies used: PAGES2k v2 and additional tree ring chronologies. Model used: CESM LME.
Visualizer Paper Data Code
Global Common Era Multiproxy Temperature Field Reconstructions
These Multi-method Common Era reconstructions represent a collection of six different spatially complete temperature reconstructions. Proxies used: PAGES2k. Methods used: Composite plus scale (CPS), principal-component regression (PCR), canonical correlation analysis (CCA), GraphEM, data assimilation (DA), and analogue method (AM).
Visualizer Paper Data
NADA and other Drought Atlases
A set of regional drought atlases, like the North American Drought Atlas (NADA), use a "point-by-point regression" approach to reconstruct drought values using a collection of tree rings. These atlases reconstruct the Palmer Drought Severity Index (PDSI), which is a unitless quantity where positive values indicate wetter conditions and negative values indicate drier conditions. Proxies used: Collections of tree ring chronologies (1845 for NADA). Method used: Point-by-point regression. Drought atlases:
- North American Drought Atlas (NADA)
- Old World Drought Atlas (OWDA)
- Monsoon Asia Drought Atlas (MADA)
- South American Drought Atlas (SADA)
- Eastern Australia and Zew Zealand Drought Atlas (ANZDA)
- European Russia Drought Atlas (ERDA)
- Mexican Drought Atlas (MXDA)
- North American Seasonal Precipitation Atlas (NASPA)